
FDI net inflows rise by 64.1% in May 2022; January-May Level at US$4.2 billion
Foreign direct investment (FDI) sustained its net inflows in May 2022, recording a 64.1 percent expansion year-on-year to US$742 million from the US$452 million in May 2021. 1,2
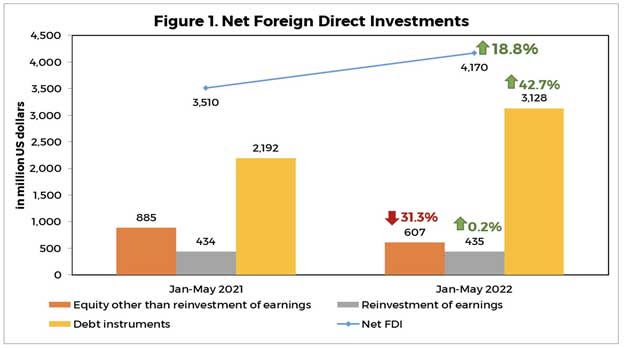
On a cumulative basis, FDI net inflows for the period January-May 2022 rose by 18.8 percent to US$4.2 billion from the US$3.5 billion net inflows posted in the same period last year (Figure 1).
The year-to-date growth was mainly on account of the increase in non-residents’ net investments in debt instruments, which muted the decline in net equity capital placements (other than reinvestment of earnings).[3]
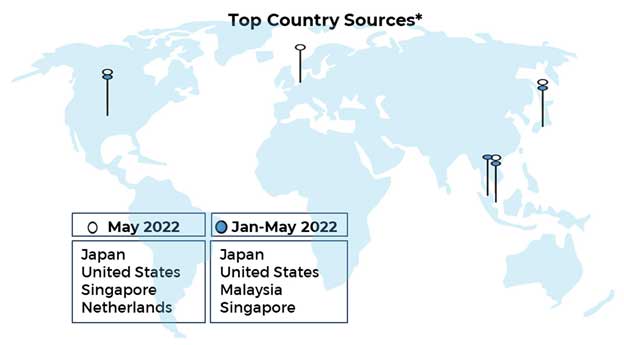
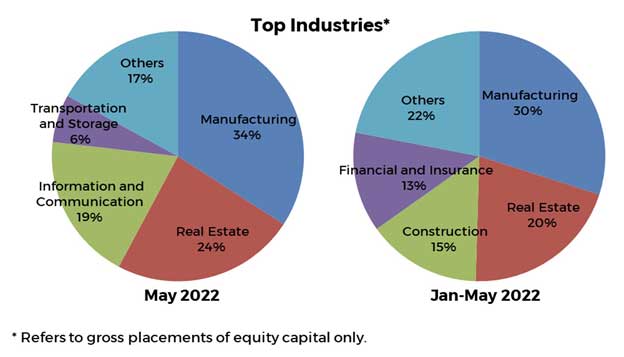
In May 2022, FDI grew following net inflows from non-residents’ net investments in debt instruments and equity capital of their local affiliates. By country of source, equity capital placements came largely from Japan, the United States, Singapore and the Netherlands. These were invested mostly in the 1) manufacturing; 2) real estate; 3) information and communication; and 4) transportation and storage industries.
1 The BSP statistics on FDI are compiled based on the Balance of Payments and International Investment Position Manual, 6th Edition (BPM6). FDI includes (a) investment by a non-resident direct investor in a resident enterprise, whose equity capital in the latter is at least 10 percent, and (b) investment made by a non-resident subsidiary/associate in its resident direct investor. FDI can be in the form of equity capital, reinvestment of earnings, and borrowings.
2 The BSP FDI statistics are distinct from the investment data of other government sources. BSP FDI covers actual investment inflows. By contrast, the approved foreign investments data that are published by the Philippine Statistics Authority (PSA), which are sourced from Investment Promotion Agencies (IPAs), represent investment commitments, which may not necessarily be realized fully, in a given period. Further, the said PSA data are not based on the 10 percent ownership criterion under BPM6. Moreover, the BSP’s FDI data are presented in net terms (i.e., equity capital placements less withdrawals), while the PSA’s foreign investment data do not account for equity withdrawals.
[3] Net investments in debt instruments consist mainly of intercompany borrowing/lending between foreign direct investors and their subsidiaries/affiliates in the Philippines. The remaining portion of net investments in debt instruments are investments made by non-resident subsidiaries/associates in their resident direct investors, i.e., reverse investment.
Comments (0)
LEAVE A REPLY
No comments yet
Be the first to share your thoughts!


