
FDI Net Inflows Rise by 50.2 Percent in October 2024
Foreign direct investment (FDI) net inflows grew by 50.2 percent to US$1.0 billion in October 2024 from US$681 million in October 2023 (Figure 1).1,2 The increase in net FDI inflows was due to the 60.7 percent growth in nonresidents’ net investments in debt instruments to US$839 million from US$522 million.3 Likewise, nonresidents’ net investments in equity capital (other

By Staff Writer
Foreign direct investment (FDI) net inflows grew by 50.2 percent to US$1.0 billion in October 2024 from US$681 million in October 2023 (Figure 1).1,2
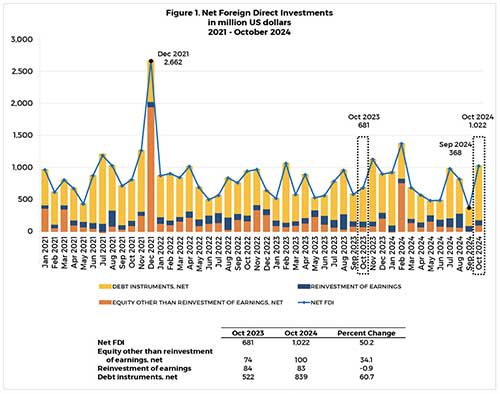
The increase in net FDI inflows was due to the 60.7 percent growth in nonresidents’ net investments in debt instruments to US$839 million from US$522 million.3
Likewise, nonresidents’ net investments in equity capital (other than reinvestment of earnings) rose by 34.1 percent to US$100 million from US$74 million. Meanwhile, the growth in FDI inflows was moderated by a marginal contraction in nonresidents’ reinvestment of earnings.
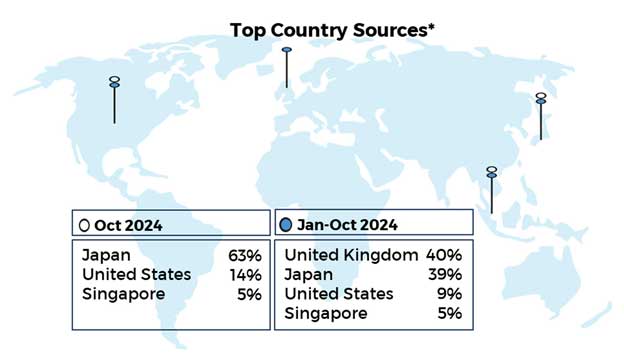
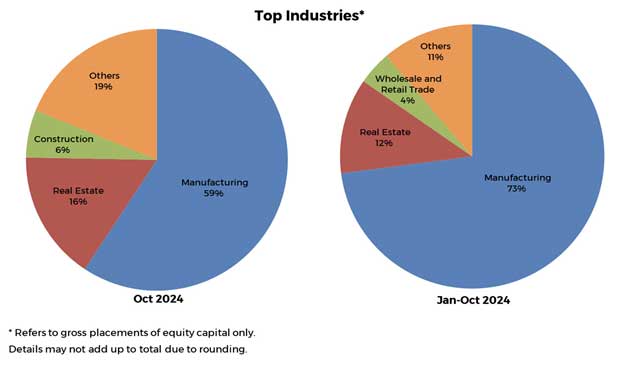
This decreased by 0.9 percent to US$83 million from US$84 million in October 2023. Equity capital placements in October 2024 came largely from Japan, the United States, and Singapore. These investments were directed primarily to the manufacturing, real estate, and construction industries.
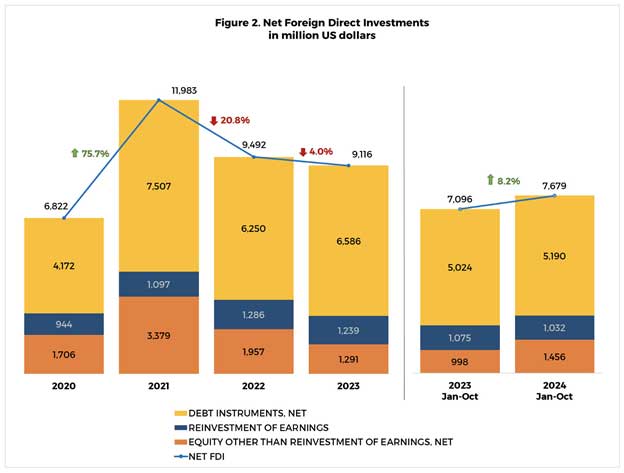
The said developments brought the January-October 2024 FDI net inflows to US$7.7 billion. This represents a growth of 8.2 percent from the US$7.1 billion net inflows in January-October 2023 (Figure 2).
1 BSP statistics on FDI are compiled based on the Balance of Payments and International Investment PositionManual, 6th Edition (BPM6). FDI includes investment by a nonresident direct investor in a resident enterprise, where the equity capital in the latter is at least 10 percent. It also includes investment made by a nonresident subsidiary or associate in its resident direct investor. FDI can be in the form of equity capital, reinvestment of
earnings, and borrowings.
2 BSP FDI statistics are different from the investment data of other government sources. BSP FDI covers actual investment inflows. In contrast, the approved foreign investments data published by the Philippine Statistics Authority (PSA) are sourced from Investment Promotion Agencies (IPAs). These represent investment commitments, which may not necessarily be fully realized in a given period. Furthermore, the PSA data are not based on the 10-percent foreign ownership criterion under BPM6. Additionally, the BSP’s FDI data are presented in net terms (i.e., equity capital placements less withdrawals). On the other hand, the PSA’s foreign investment data do not account for equity withdrawals.
3 Net investments in debt instruments consist mainly of intercompany borrowing and lending between foreign direct investors and their subsidiaries or affiliates in the Philippines. The remaining portion of net investments in debt instruments are investments made by nonresident subsidiaries or associates in their resident direct investors. This is known as reverse investment.
Article Information
Comments (0)
LEAVE A REPLY
No comments yet
Be the first to share your thoughts!


