


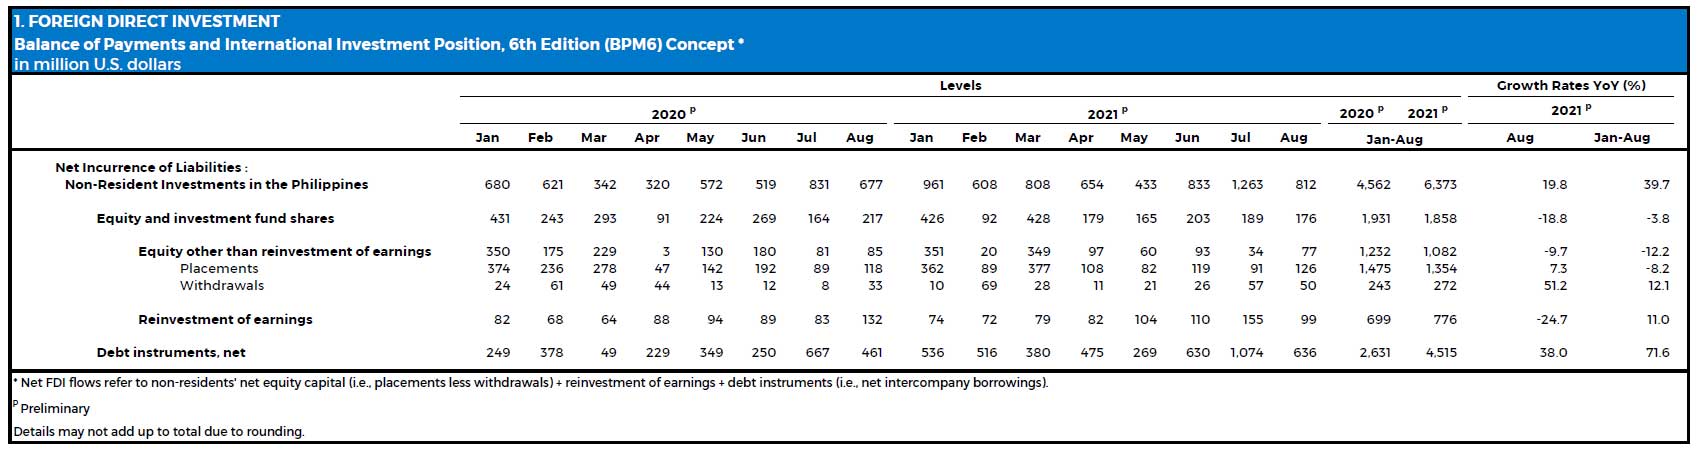
Foreign direct investment (FDI) net inflows in August 2021 expanded by 19.8 percent year-on-year to reach US$812 million from US$677 million in the same period in 2020 (Table 1).1,2
This development brought the FDI net inflows for the first eight months of the year to US$6.4 billion, higher by 39.7 percent than the US$4.6 billion net inflows in the comparable period in 2020.
The cumulative FDI net inflows rose on the back of the 71.6 percent growth in non-residents’ net investments in debt instruments to US$4.5 billion from US$2.6 billion.[3]
Likewise, reinvestment of earnings rose by 11.0 percent to US$776 million from the US$699 million registered last year. However, non-residents’ net investments in equity capital (other than reinvestment of earnings) declined by 12.2 percent to US$1.1 billion, from US$1.2 billion a year ago.
Net investments in equity capital fell as placements dropped by 8.2 percent to US$1.4 billion (from US$1.5 billion) and withdrawals increased by 12.1 percent to US$272 million (from US$243 million).
Equity capital placements were sourced primarily from Singapore, Japan, and the United States. These were channeled mainly in the 1) manufacturing; 2) financial and insurance; 3) electricity, gas, steam, and air-conditioning; and 4) real estate industries.
For the month of August 2021, the expansion in FDI net inflows was driven by non-residents’ net investments in debt instruments, which grew by 38.0 percent year-on-year to US$636 million from US$461 million in August 2020.
Meanwhile, reinvestment of earnings contracted by 24.7 percent to US$99 million from US$132 million. Likewise, non-residents’ net investments in equity capital declined by 9.7 percent to US$77 million from US$85 million in August 2020.
This was due to the rise in equity capital withdrawals (by 51.2 percent to US$50 million from US$33 million), which more than offset the increase in equity capital placements (by 7.3 percent to US$126 million from US$118 million).
Equity capital placements originated mostly from Japan, the Netherlands, and the United States. These were directed largely to the 1) manufacturing; 2) information and communication; and 3) real estate industries.
1 The BSP statistics on FDI are compiled based on the Balance of Payments and International Investment Position Manual, 6th Edition (BPM6). FDI includes (a) investment by a non-resident direct investor in a resident enterprise, whose equity capital in the latter is at least 10 percent, and (b) investment made by a non-resident subsidiary/associate in its resident direct investor. FDI can be in the form of equity capital, reinvestment of earnings, and borrowings.
2 The BSP FDI statistics are distinct from the investment data of other government sources. BSP FDI covers actual investment inflows. By contrast, the approved foreign investments data that are published by the Philippine Statistics Authority (PSA), which are sourced from Investment Promotion Agencies (IPAs), represent investment commitments, which may not necessarily be realized fully, in a given period. Further, the said PSA data are not based on the 10 percent ownership criterion under BPM6. Moreover, the BSP’s FDI data are presented in net terms (i.e., equity capital placements less withdrawals), while the PSA’s foreign investment data do not account for equity withdrawals.
[3] Net investments in debt instruments consist mainly of intercompany borrowing/lending between foreign direct investors and their subsidiaries/affiliates in the Philippines. The remaining portion of net investments in debt instruments are investments made by non-resident subsidiaries/associates in their resident direct investors, i.e., reverse investment.

